AI and Data Insights in Scientific Visualization
Written by Adithya Salgadu
Table of Contents
ToggleMaking Sense of Scientific Data with AI
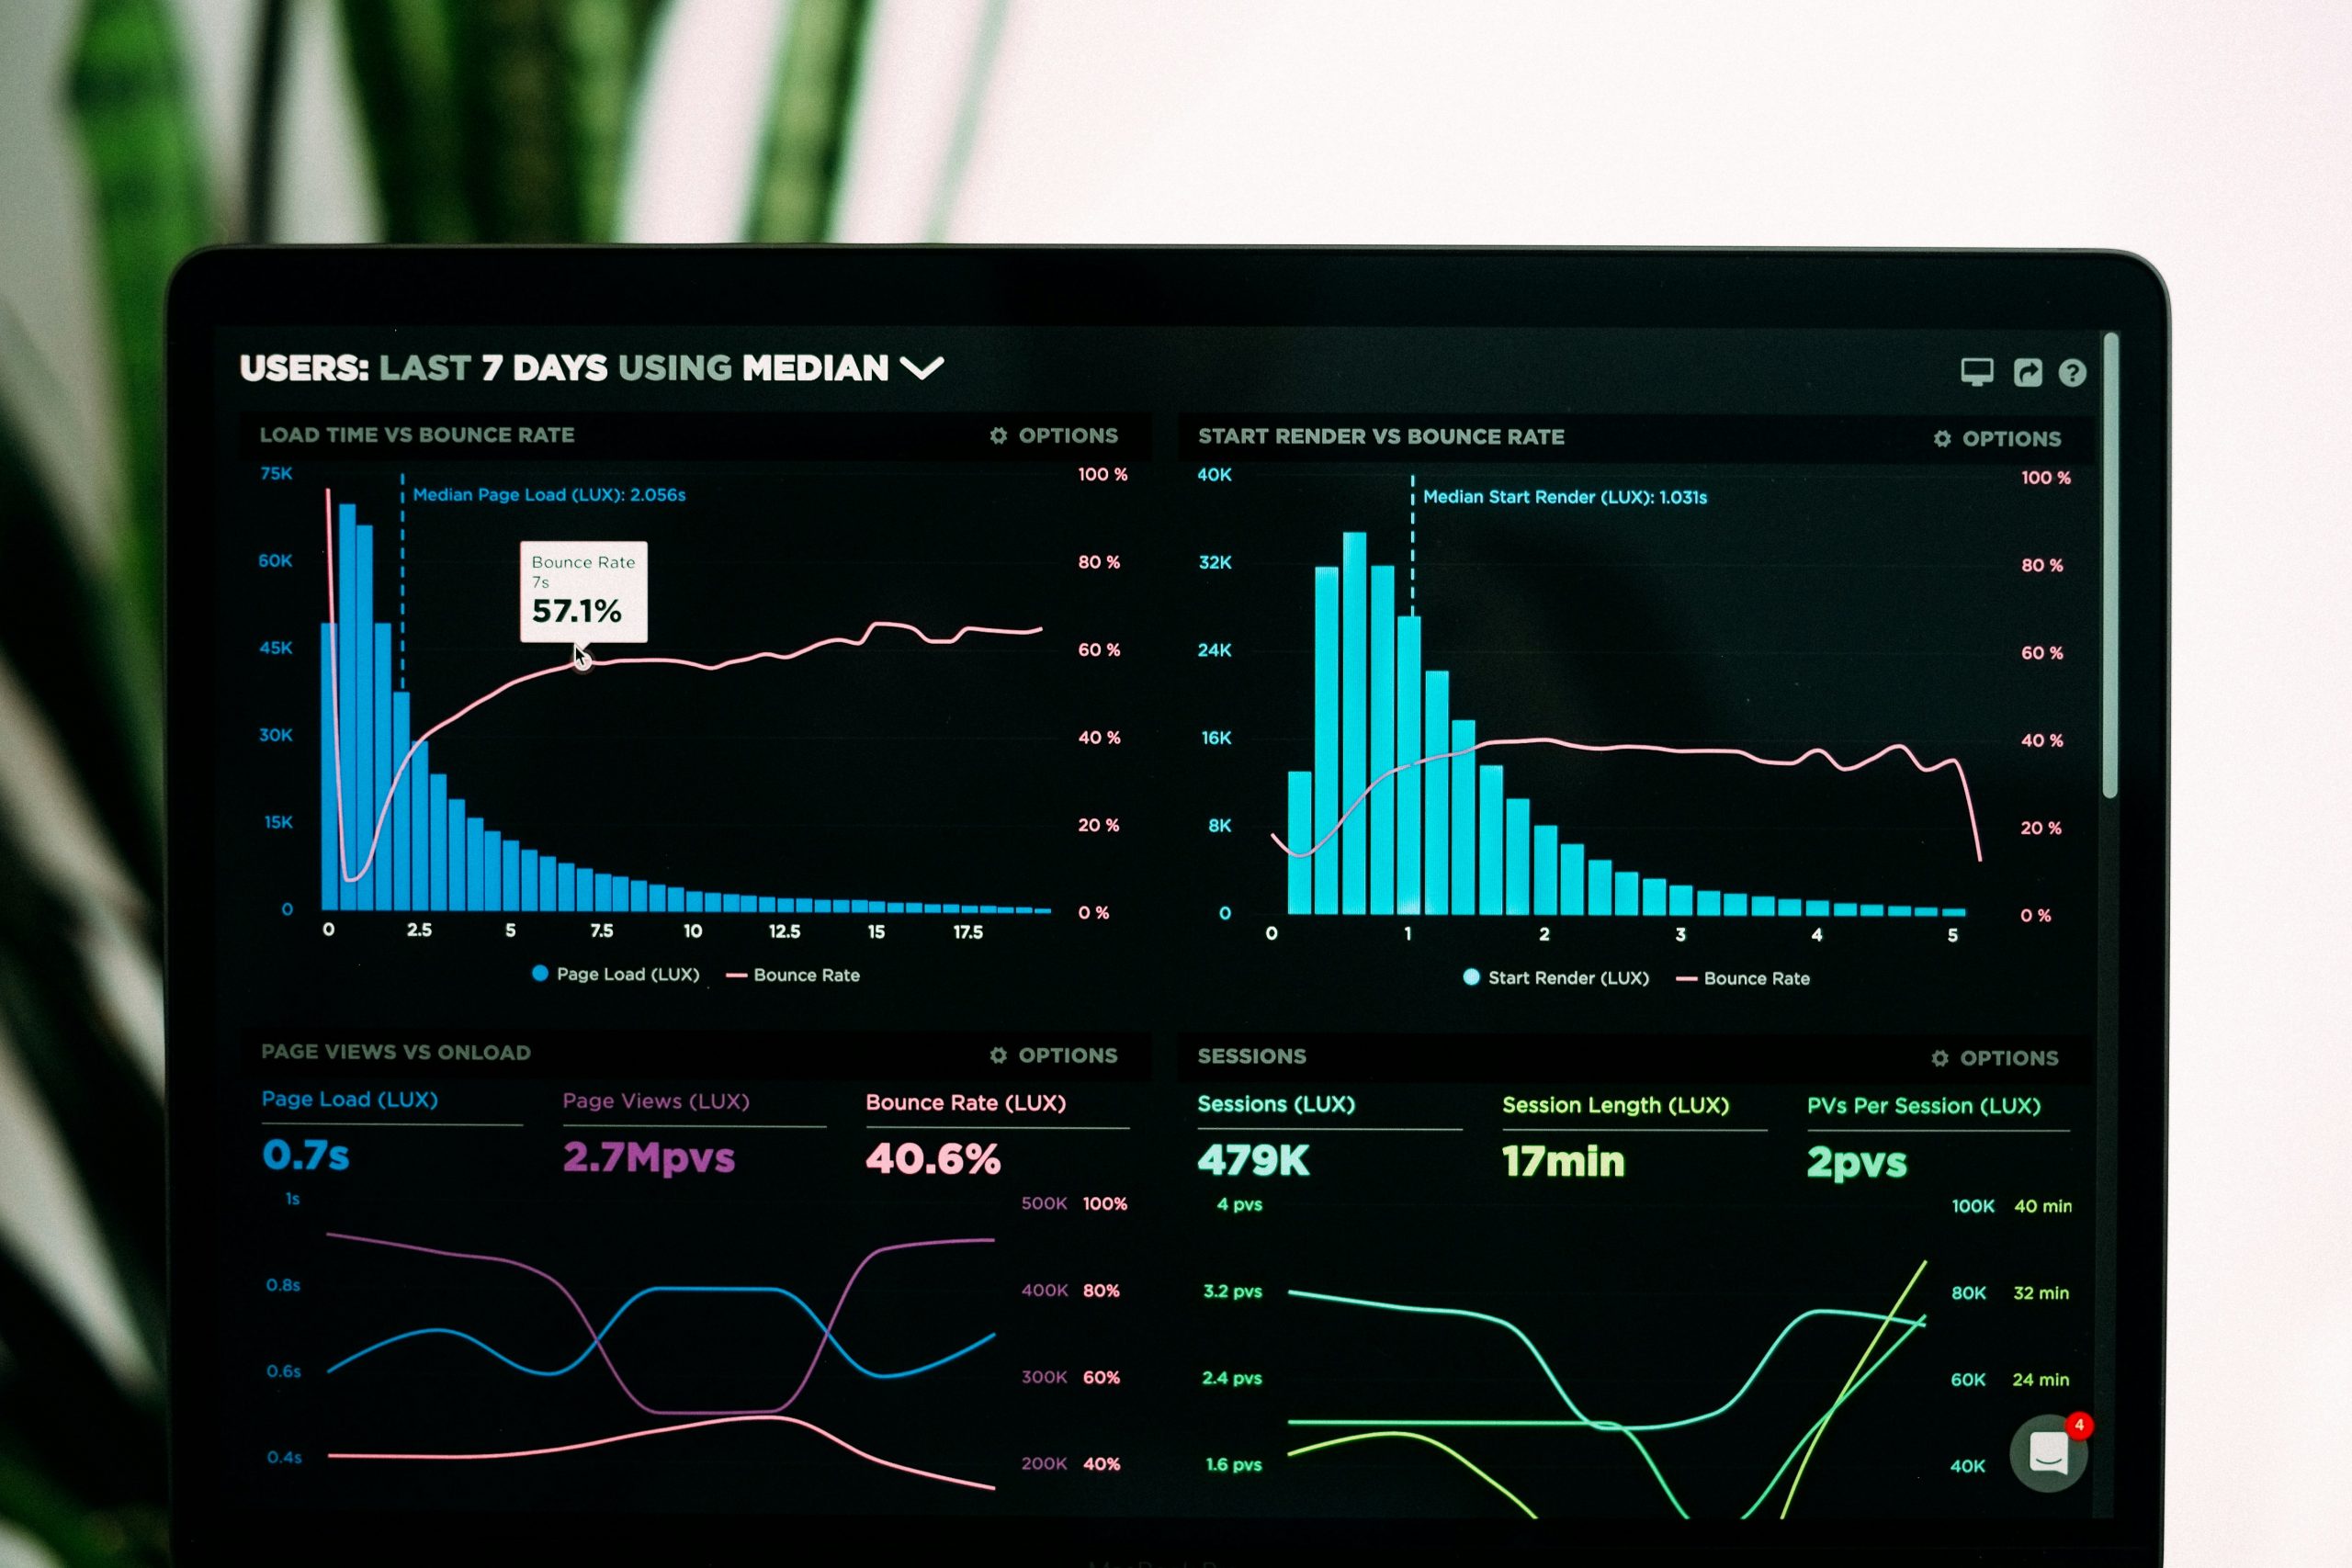
Science runs on data. But understanding complex datasets is tough without the right tools. That’s where Scientific Visualization and AI step in. They turn raw numbers into visual insights you can understand at a glance.
In this article, you’ll learn what Scientific means, how AI improves it, tools used, challenges, and future trends. Whether you’re in medicine, physics, or data science, this guide is for you.
Want to learn more about visualization trends? Check out our AI in Research Tools Guide.
What is Scientific Visualization?
Scientific Visualization is the process of converting scientific data into visual formats like graphs, charts, and 3D models. This helps scientists and researchers:
-
Spot trends and patterns
-
Communicate results clearly
-
Make data-driven decisions
Common uses include:
-
Viewing medical scans
-
Analyzing weather models
-
Mapping environmental data
It’s not just about making things look good—it’s about making complex science understandable.
How AI Enhances Scientific Visualization
AI plays a major role in improving Scientific Visualization. Here’s how:
-
Automates visual creation: AI processes large datasets faster than humans.
-
Improves accuracy: Reduces human error and highlights hidden patterns.
-
Enhances predictions: Machine learning helps forecast outcomes.
For example, AI can automatically generate 3D brain models from raw MRI data—saving hours of manual work.
Looking to boost your workflow? Read our internal post on AI Data Processing.
Top Tools Used in Scientific Visualization with AI
Here are tools that blend AI with Scientific Visualization:
1. ParaView
Open-source software used for scientific data analysis and rendering.
2. VisIt
Great for visualizing very large datasets, often used in physics and climate research.
3. NVIDIA Omniverse
Supports real-time simulations with AI-assisted rendering.
4. TensorFlow + Python Libraries
Developers use AI frameworks like TensorFlow with visualization tools like Matplotlib and Seaborn.
These tools make it easier to turn millions of data points into clear, readable visuals.
Applications of Visualization in the Real World
Scientific Visualization has real impact in many fields:
Medicine
AI helps visualize organs and tissues using imaging data, improving diagnosis and surgery planning.
Climate Science
Researchers use visualization to track changes in temperature, sea levels, and weather patterns.
Space Exploration
NASA uses AI to process and visualize satellite data and star maps.
These applications help experts make faster and more accurate decisions.
Challenges of Using AI in Scientific Visualization
Despite its benefits, Scientific Visualization with AI comes with challenges:
-
Data quality: Poor input data means poor visual results.
-
Hardware needs: Some tools require powerful computers or GPUs.
-
Bias in models: AI can miss important features if trained incorrectly.
Understanding these issues helps users get better results and avoid misinterpretation.
The Future of Scientific Visualization with AI
As AI improves, so does Visualization. Here’s what’s ahead:
-
Interactive dashboards: Real-time graphs with predictive insights
-
Augmented Reality (AR): Visualizing data in 3D space using AR headsets
-
Smart visualization assistants: AI that suggests the best charts or models for your data
The future is visual, interactive, and powered by smart tools that keep learning.
Tips to Get Started with Scientific Visualization Tools
If you’re new to this space, here are some beginner-friendly tips:
-
Start with free tools like ParaView or VisIt
-
Learn basic Python for working with visualization libraries
-
Choose clean, high-quality datasets to avoid messy outputs
-
Experiment with different graph types to see what tells the story best
Want more beginner tips? Visit our Getting Started with Data Tools post.
FAQs
What is Scientific Visualization used for?
It helps scientists turn raw data into readable visuals to discover patterns and insights.
How does AI improve Visualization?
AI speeds up data processing, improves accuracy, and enables predictive visual models.
Which industries use Scientific Visualization?
Fields like healthcare, climate science, physics, and engineering rely on it daily.
Are there free tools available?
Yes! Tools like ParaView and VisIt are open-source and widely used in research.
Do I need a powerful computer to use visualization tools?
Some tools run fine on standard PCs, but others require GPUs for large datasets.
Why Scientific Visualization Is Essential for Modern Science
AI-powered Scientific Visualization makes science more understandable and impactful. It takes complex data and turns it into clear insights. This allows faster decisions, better communication, and smarter research.
Whether you’re exploring the human body or the galaxy, visualization makes your data speak. It’s the future of science—and that future is already here.
Author Profile

- Adithya SalgaduOnline Media & PR Strategist
- Hello there! I'm Online Media & PR Strategist at NeticSpace | Passionate Journalist, Blogger, and SEO Specialist
Latest entries
 AI WorkflowsMarch 18, 2026Nvidia AI Graphics Backlash Explained for Gamers Today
 NetworkingMarch 17, 2026High Speed Networking for Quantum AI Systems Growth
 Vehicle SimulationMarch 11, 2026Physical AI Integration Driving the Future of Smart Cars
 AI WorkflowsMarch 9, 2026AI Insurance Underwriting: Gradient AI Funding Impact
