Best Real-Time Visualization Tool for Algorithms & Data
See Your Code in Action Instantly
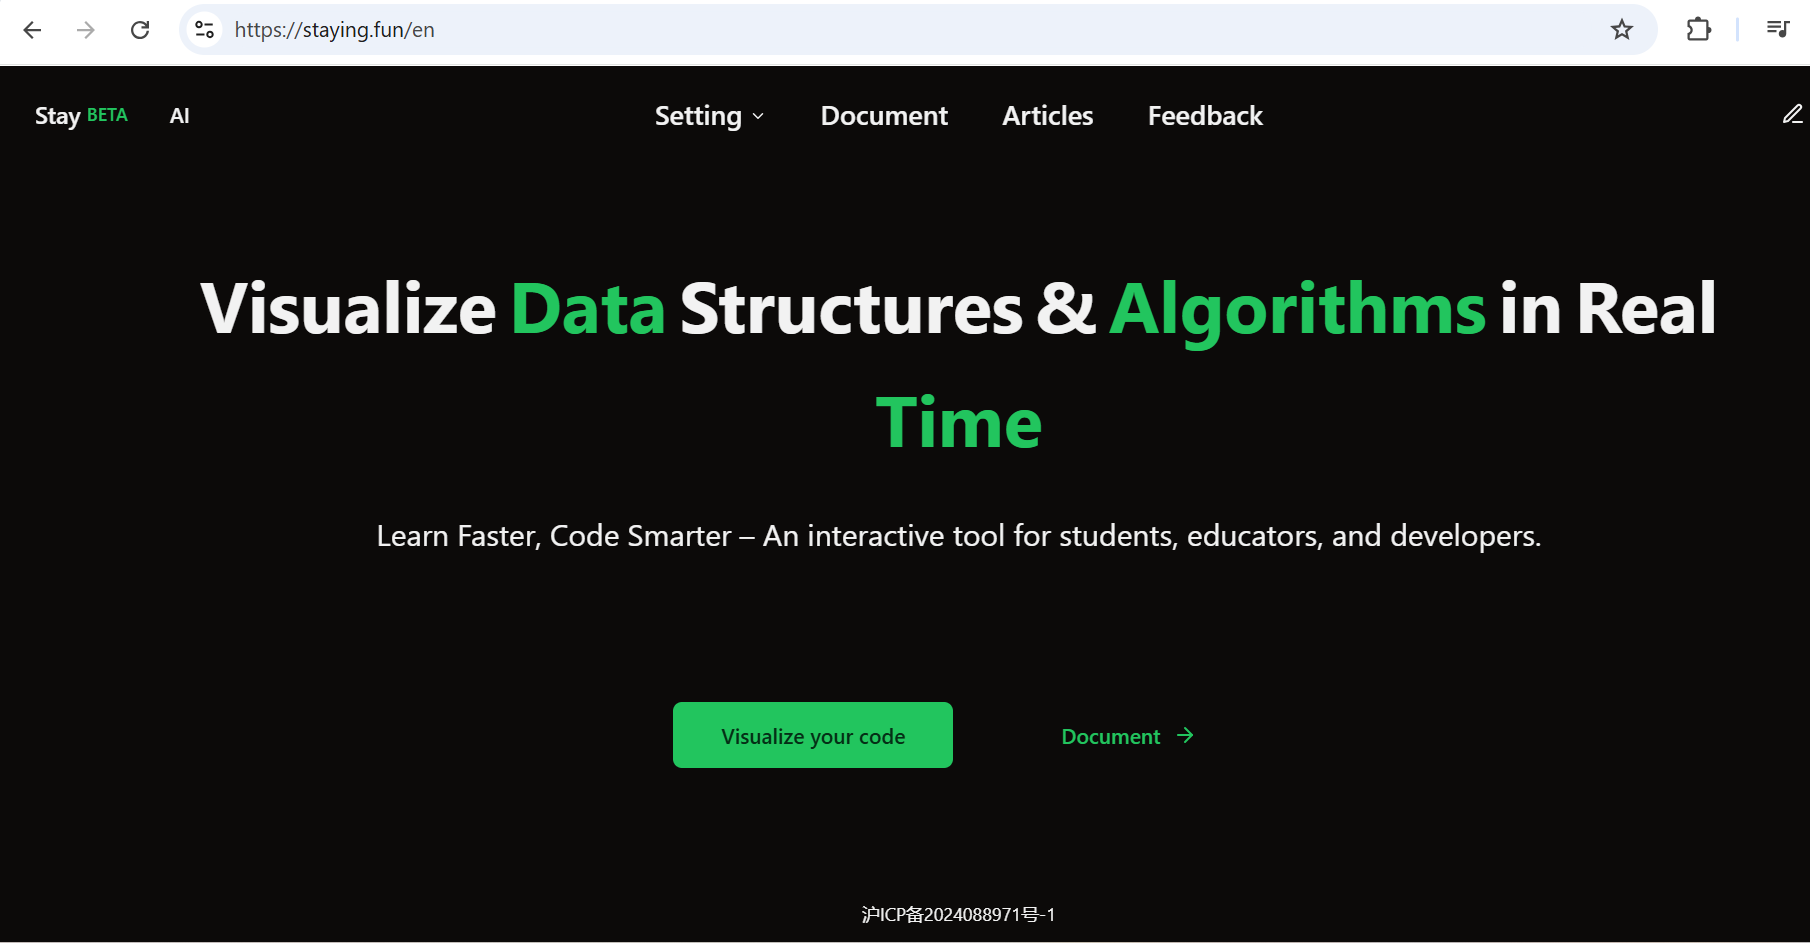
Many developers and students find data structures difficult to visualize. That’s where the real-time visualization tool from Staying.fun comes in. It helps you understand how your code works by turning logic into animations with zero login or setup required.
In this post, you’ll learn how this tool works, why it’s perfect for debugging and teaching, and how you can start using it right now.
What is the Real-Time Visualization Tool?
The real-time visualization tool is a free, browser-based platform. It transforms code execution into live visual animations. Whether you’re working with:
-
Recursion
-
2D arrays
-
Linked lists
-
Stacks or queues
this platform provides a clear, step-by-step view of how your logic flows.
And yes, you can paste in your own code without needing an account.
How the Real-Time Visualization Tool Helps You Learn
Understand Algorithms Clearly
Algorithms like quicksort, DFS, or backtracking can be tricky in theory. With the real-time visualization tool, these concepts become concrete. You’ll watch:
-
Memory allocation in real-time
-
Recursion stack frames
-
Pointer movements in linked lists
Interactive and User-Friendly Interface
Using Staying.fun is simple:
-
Open the site here.
-
Choose a data structure or algorithm.
-
Type or paste your code.
-
Press play and watch your logic animate!
The interface is beginner-friendly and doesn’t overwhelm users with advanced settings.
Why Developers and Educators Love This Real-Time Visualization Tool
No Login Required
Unlike many platforms, this real-time visualization tool requires no registration. That makes it ideal for:
-
Quick debugging
-
Classroom demonstrations
-
Self-paced learning
Great for Teaching
Instructors can use it during live lessons or share the visual output with students. This reduces confusion and boosts engagement. For remote learners, it’s a game changer.
Best Ways to Use the Real-Time Visualization Tool
Debugging Your Own Logic
Paste your function into the editor and hit run. Whether it’s a for loop error or pointer mistake, you’ll spot it immediately.
Learning Step-by-Step
Not sure how merge sort splits arrays? The tool shows each split and merge in a visual sequence.
Comparing Algorithm Efficiency
Run different algorithms side by side to observe how they perform on the same input. Visually compare speed, recursion depth, and space usage.
Key Features of This Real-Time Visualization Tool
-
No login needed
-
Works on all modern browsers
-
Supports many algorithm types
-
Visualizes recursion, arrays, stacks, and more
-
Clean, easy to use interface
Frequently Asked Questions (FAQ)
What languages does the real-time visualization tool support?
Currently, it supports JavaScript, but more language support is in development.
Can I use it on mobile?
Yes, but it’s optimized for desktop. For best experience, use a laptop or tablet.
Is it suitable for beginners?
Absolutely. The UI is designed for ease, and you don’t need any advanced setup to start.
Is the platform free?
Yes. It’s 100% free and doesn’t even ask for a sign-up.
Try the Real-Time Visualization Tool Today
Whether you’re a student, educator, or developer, this real-time visualization tool from Staying.fun is a must-have.
You can understand difficult algorithms, debug your own code, or teach concepts more clearly. And best of all no login, no cost.
we got a tool for Build Your Own Custom Car Online in Minutes.
Start visualizing your code today and take your learning to the next level.
Author Profile

- Online Media & PR Strategist
- Hello there! I'm Online Media & PR Strategist at NeticSpace | Passionate Journalist, Blogger, and SEO Specialist
Latest entries
 AI WorkflowsJune 30, 2026X MCP Server Helps AI Tools Connect Faster and Smarter
 AI PlatformJune 19, 2026Microsoft AI Strategy Shapes China’s Enterprise AI Future
 AI WorkflowsJune 16, 2026Reliable AI Systems: Why Probably’s $9M Funding Matters
 AI WorkflowsJune 15, 2026AI Shopping Agents: Why Consumers Trust Them More
